Here it is as big as I can make it.
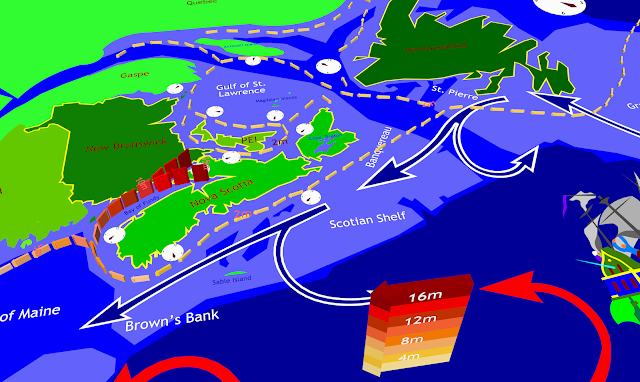
Tides are an extremely complex phenomenon, but this chart is done in black and white with intuitive graphics and not much written explanation. The swoopy lines and hour ticks give a real sense of motion. I think it's a masterpiece, where art meets science.
At the time, Edward R. Tufte was writing his books on visualization, and I sent him a copy and got a nice response, but he never used the graphic. It meets several of Tufte's criteria - no excessive use of color for it's own sake, no "chartjunk", and a high data/ink ratio. More importantly, it foreshadows the widespread use of "sparklines" with the small local insets. Brilliant!
My copy of the chart is only 11 X 17 - I think there were bigger ones made,, maybe 30 X 50. I might have considered using clock faces instead of numbers for the time, but otherwise I'm not sure how it could be improved.
I recently discovered sort of a companion piece by Desplanques and David Mossman of Mt Allison, dating from 2001, published in Geoscience Canada. And this is a very detailed and helpful analysis by H. A. Marmer published in the Geographical Review Vol. 12, No. 2 (Apr., 1922), pp. 195-205
Desplanques explicitly confines himself to the where, when and how much questions. Looking at Desplanques' creation in detail shows many levels. We can add precision and detail, but it's hard to improve on the effectiveness of the presentation.
In the end, I'm left to wonder about three things - more "why" questions and more difficult to explain visually:
- What's with the circular pattern in the Gulf of St. Lawrence?
- Why are the tides so high in the Bay of Fundy?
- What are the diurnal tides on the East Coast of New Brunswick and on the Gulf side of PEI?
First, a refresher in freshman physics:
- The Earth spins once a day on its axis
- Everything on earth is attracted by the gravitational force of the moon, but the water, free to move, piles up in a bubble shape under the moon
- A corresponding bubble occurs exactly opposite because it is farthest from the moon and least attracted.
- Some sources say the bubble away from the moon is caused by the rotation of the earth-moon system and resultant "centrifugal forces". For a god discussion of why differential gravitational effects are a better explanation, see this NASA classroom experiment.
- The moon orbits the Earth once a month
- When the moon is opposite the sun, the moon is full
- The gravity of the moon is opposed by the gravity of the sun and the tides are less pronounced
- When the moon is on the sun side, the moon is new.
- The moon and the sun act together to make higher tides
- When the moon and sun are not aligned, tides are more even.
- The continents get in the way
- As the earth spins on its axis, anything in motion gets deflected from a straight line. This is called the Coreolis effect
This map shows all the tidal stations in Atlantic Canada. Click an icon for a plot of high and low tides in January, 2015.
What's with the circular pattern in the Gulf of St. Lawrence?
In the Gulf of St. Lawrence you can plot the time of high tide, using the circular arrangement of the stations to advantage:
The displacement of the gravity-caused bulges, moving East to West through the gulf, is directed south by the moving frame of reference. Although the correspondence isn't perfect, you can see clearly that high tide proceeds counter-clockwise around the gulf. Think of the Gulf as a washbasin with the water sloshing around. In the middle, very close to Iles de la Madeleine, is the center of slosh.
Why are the tides so high in the Bay of Fundy?
This 1870 map (interesting in itself) gives a picture of the Atlantic tides that seems to agree with the bar chart above: high tide arrives pretty simultaneously along the entire coast. Also from the bar chart, we see that high tide reaches Yarmouth a couple of hours after it reaches Shelburne, and only two hours later it's all the way up the bay at Burncoat Head. All this agrees with Desplanque's original map.
A seiche is a standing wave in a bay or basin that occurs because the tidal interval is similar to the time it takes for the wave to propagate along the bay. In theory, the tide entering the bay takes about 6 hours to travel up to the Minas Basin and empty back down.
What are the diurnal tides on the East Coast of New Brunswick and on the Gulf side of PEI?
If you look carefully on Desplanque's map, you see something complicated happening just about at the bridge to PEI. All the movement in the Northumberland Strait is East-West, meaning that the high tide has come around the East end and collides with the high tide coming counter clockwise into the West end. Examples:
Mixed Semidiurnal: Two highs and two lows each day. The lower high and higher low are from the tidal bulge opposite the moon.
Semidiurnal: Two highs and two lows each day - highs and lows of nearly equal magnitude. Monthly highs correspond to days when the moon is waxing or waning.
Diurnal: 31 highs and 31 lows. The are examples of diurnal tides worldwide
Sometimes Diurnal: When the moon is waxing or waning, the high tide moving east to west in the northumberland Strait is high enough to cancel the effect of the oncoming tide.
Here is a version of Desplanque's map done in Sketchup:


